
Figure 4.
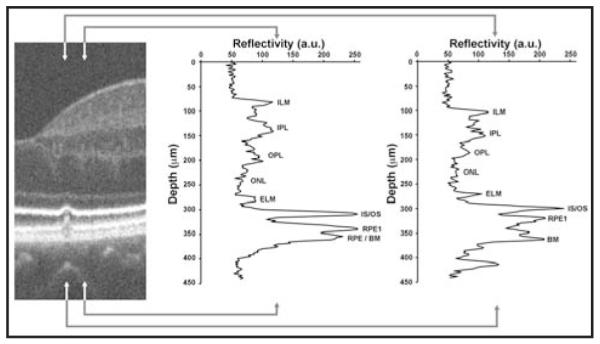
Disruption of the inner segment/outer segment (IS/OS) layers. On the left is a segment of the spectral domain optical coherence tomography (SD-OCT) image centered on the 65-μm wide druse. Longitudinal reflectivity profiles have been plotted for the area of retina between the arrowheads. The middle plot shows normal-appearing retinal layers just temporal to the druse. In the SD-OCT images, the gray scale represents signal amplitude: low reflecting layers indicate nuclear layers, whereas high reflectivity typically comes from synaptic layers in the healthy retina. Assignment of layers is based on literature consensus.29-31 The right plot shows significant thinning of the outer segment layer (distance between IS/OS and the first retinal pigment epithelium [RPE1] layers). The distance between RPE1 and Bruch’s membrane (BM) is presumably occupied by the druse. The IS/OS layer itself appeared attenuated or “pinched,” being 30% thinner (full-width half maximum) directly above the druse compared to immediately adjacent to the druse. ILM = inner limiting membrane; OPL = outer plexiform layer; ELM = external limiting membrane; IPL = inner plexiform layer; ONL = outer nuclear layer; a. u. = arbitrary units.