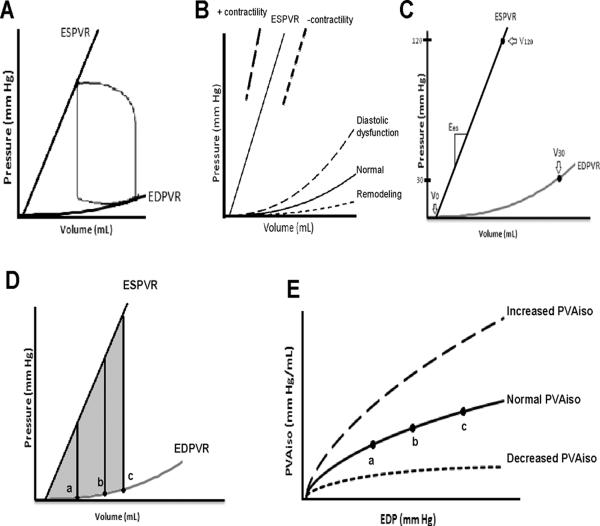
Figure 1.
(Upper Figures) Pressure-volume analyses demonstrating the normal PV loop and the determinants of ventricular function, including the ESPVR and the EDPVR (Panel A). Shifts in the ESPVR are often equated with changes in inotropic state (Panel B), while shifts in the EDPVR toward smaller volumes or reduced capacitance (diastolic dysfunction) or toward larger volumes or increased capacitance (remodeling). The ESPVR is characterized by the slope [Ees] and the volume axis intercept [V0], which can be described collectively by the V120, the volume of the left ventricle required to generate an end systolic pressure of 120 mm Hg (Panel C). Shifts in the EDPVR can be characterized by V30, the ventricular volume at a pressure of 30 mm Hg, (Panel C). See Methods section for additional details.
(Lower Figures) Demonstration of how PVAiso is calculated from the PV diagram (Panels D and E). One value for PVAiso (shaded area) can be obtained for each end-diastolic PV point shown by the black circles along the EDPVR. The points of a, b, and c in Panel D correspond to the solid line PVAiso curve in Panel E. With shifts of the ESPVR and EDPVR (not shown), the PVAiso curve can show increased or decreased cardiac function (dashed PVAiso curves), Panel E.

