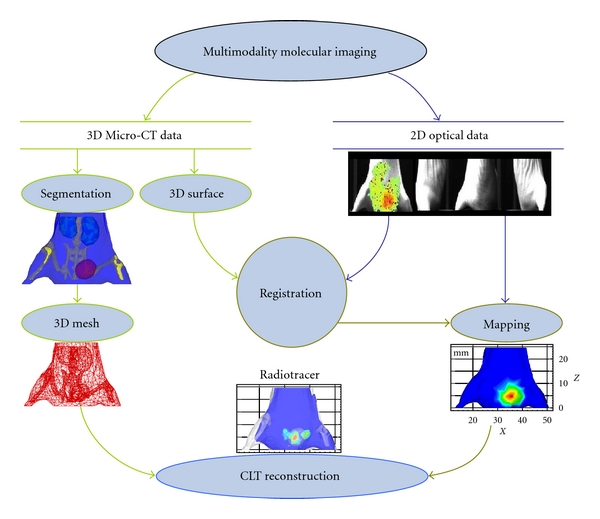
Figure 4.

Schematic of radioactive source distribution reconstruction with optical property heterogeneity. The mouse was scanned by our multimodal molecular imaging system. 3D MicroCT data and planar optical images were collected by the same system. The interval degree was 90 for multiangle imaging. 2D optical intensity distribution is mapped on the 3D surface in accordance with the registering relationship. CLT is the output of the information fusion and optical tomography reconstruction.
