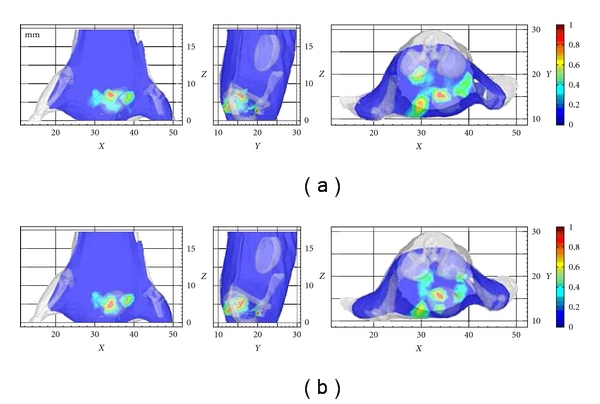
Figure 5.

Slices of the in vivo flux density distribution through the reconstructed source center successively from XZ, YZ, and XY views. (a) Three slices from 3D views in HM; (b) three slices from 3D views in HR. Peak values of the flux densities in different slices were normalized to 1, in order to simultaneously demonstrate reconstructed source centers. The unit of the X, Y, and Z axes is in mm.
