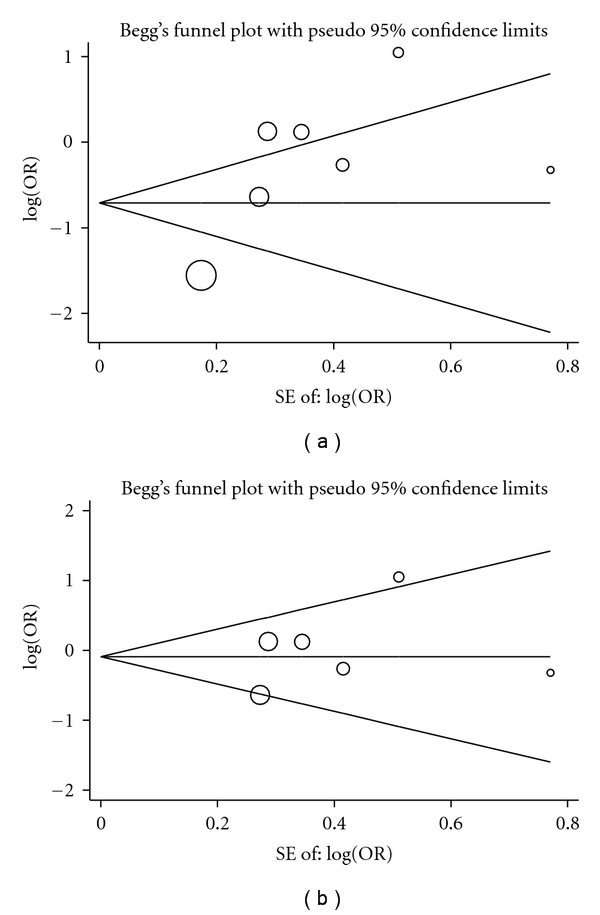
Figure 3.

Funnel plots for studies investigating the effect of ANP gene T2238C polymorphism on the risk of hypertension in overall allelic model (a) and after excluding the most influential study (b). Vertical axis represents the log of OR; horizontal axis represents the SE of log(OR). Funnel plots are drawn with 95% confidence limits. OR, odds ratio; SE, standard error. The graphic symbols represent the data in the plot sized proportional to the inverse variance.
