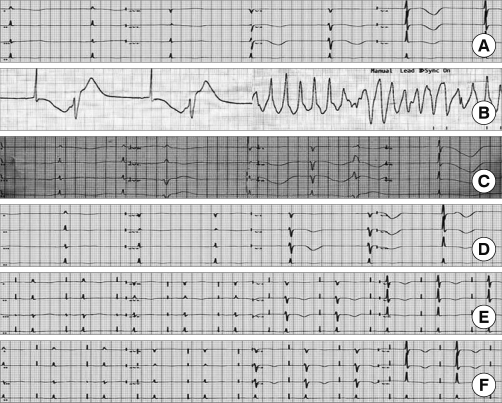
Fig. 1.
Time course of ECG changes. (A) Admission electrocardiogram (ECG) shows T-wave inversion in precordial leads and a QTc interval of 580 ms. (B) ECG on the second day shows torsade de pointes initiated by a junctional rhythm with QT prolongation and R on T phenomenon. (C) ECG on the 4th day shows a junctional rhythm with QT prolongation (QTc = 653 ms) and R-on-T phenomenon (D) ECG on the 20th day shows a severe bradycardia with QT prolongation. (E, F) ECG and 3 months after pacemaker insertion still shows QT prolongation and T-wave inversion in precordial leads.

