
Fig. 5.
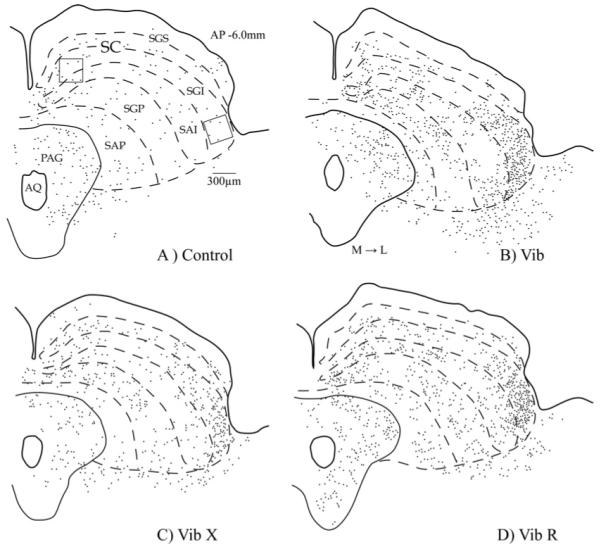
Camara lucida drawings from transverse sections of representative cases illustrating the distribution of Fos staining in the SC. Control rat (A) and rats that performed predatory behaviour: a rat with intact whiskers (Vib) (B), a rat with whiskers-removed (VibX) (C), a rat with re-grown whiskers (VibR) (D). Open squares indicate the position of the 0.09 mm2 grid (exactly to scale) within which the Fos counts were made. Abbreviations: see list. Scale bars=300 μm. M → L, direction from medial to lateral axis.