
Fig. 6.
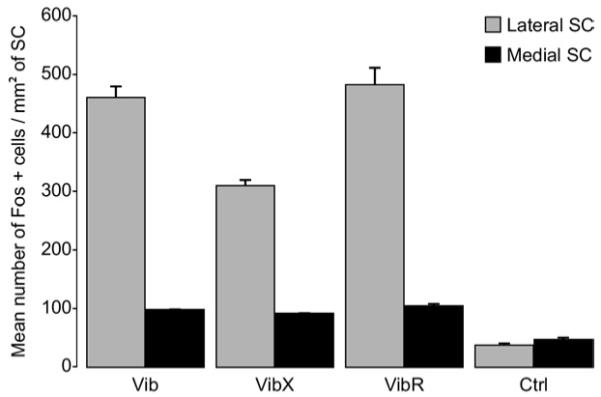
Histograms showing the mean density of Fos-immunoreactive cells in the lateral and medial parts of the SC in control animals (n=5) and animals that had performed predatory behaviour: rats with intact whiskers (Vib) (n=5), rats with whiskers-removed (VibX), and rats with re-grown whiskers rat (VibR) (n=5). Values represent the number of Fos-labeled cells/mm2. Data are expressed as mean±SEM. (Separate analysis of interaction between experimental condition (Vib, VibX and VibR)×region within the SC (lateral, medial): F=21.2; df=2.12; P=0.0001).