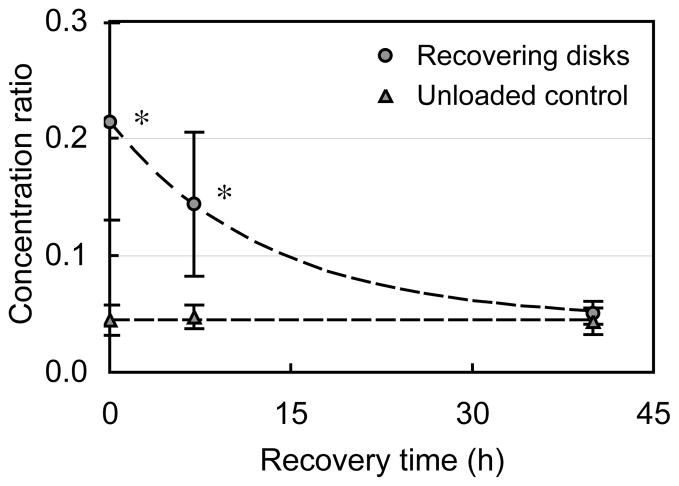
Figure 3.
Recovery response of cartilage disks in transferrin following 20 hours of dynamic loading (DL) and corresponding response in never-loaded control samples (mean ± standard deviation). These results demonstrate that DL is the primary cause for increased solute uptake, since termination of loading returns solute concentration back to PD levels. *p<0.02: significant increase above respective PD time point.

