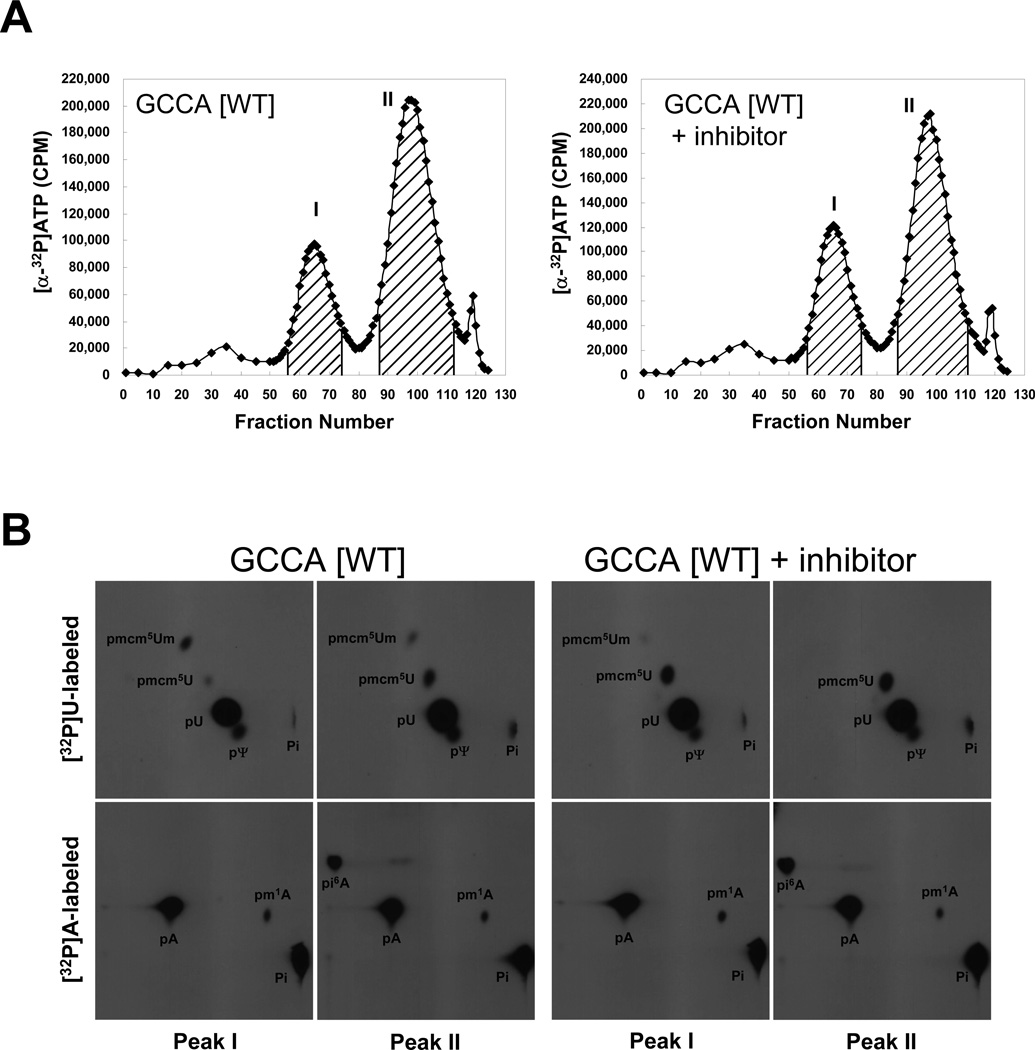
Fig. 4.
Elution profiles and modified base analysis of wild type tRNA[Ser]Sec isoforms following inhibition of SerRS. In (A), [α-32P]UTP- or [α-32P]ATP-labeled wild type (GCCA [WT]) tRNA[Ser]Sec transcript was microinjected into Xenopus oocytes with or without 20 µM SB-217452, incubated overnight, extracted, and chromatographed on a RPC-5 column as described in Materials and Methods. The graphs show the elution profiles of [α-32P]ATP labeled tRNAs. X and Y axis represent fraction number and CPM, respectively. Peaks I and II were pooled as shown by the hatched areas in the figures, collected, digested with nuclease, and in (B), the digests resolved by two-dimensional TLC as described in Materials and Methods and the modified bases and Um34 detected by autoradiography (see text and [4]). The films were exposed for 12–16 h.

