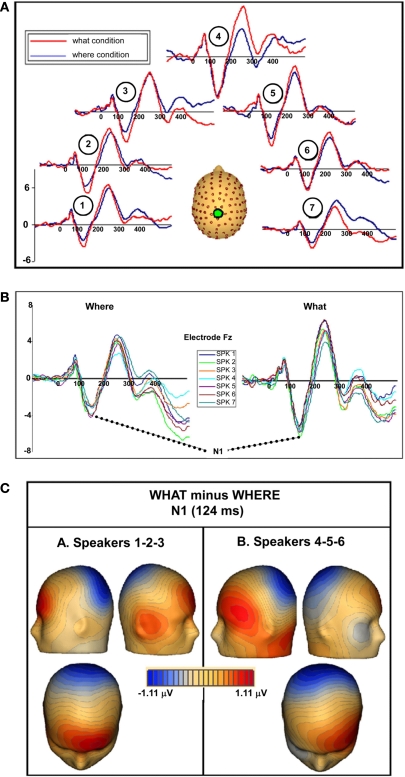
Figure 10.
(A) WHAT (red) and WHERE (blue) group-averaged waveforms taken from electrode Cz are shown for seven individual sound source averages. In the figure, each waveform pair is shown at a location consistent with the sound source from which it was derived. (B) Separate waveforms for each of the sound sources are overlaid from each condition at one representative electrode (Fz). (C) Topographic maps of the N1 difference between conditions (WHAT minus WHERE) showing distinct topographies for sound sources on the left (Sound sources 1–2–3) compared to the right (Sound sources 5–6–7).

