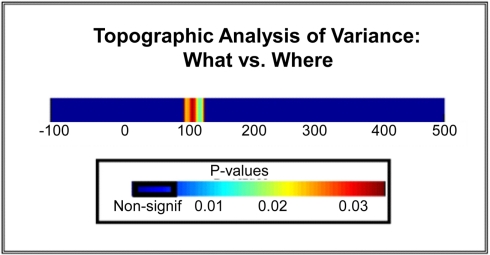
Figure 11.
Statistical plot of topographic modulations. Areas of non-significance appear in blue; areas where significance exceeds p < 0.03 are displayed in a graduated color scheme according to the legend shown. Note that this significance cluster falls in a time frame coincident with the N1 component.

