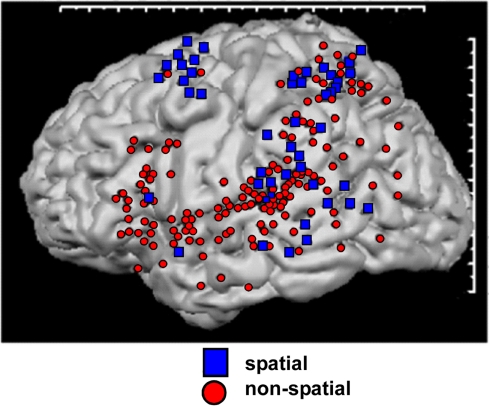
Figure 2.
Schematic representation of auditory pathways as evidenced by a meta-analysis of 11 spatial (dorsal) and 27 non-spatial (ventral) studies. Regions showing greatest activation in each study are indicated. Adapted from Arnott et al. (2004) with permission.

