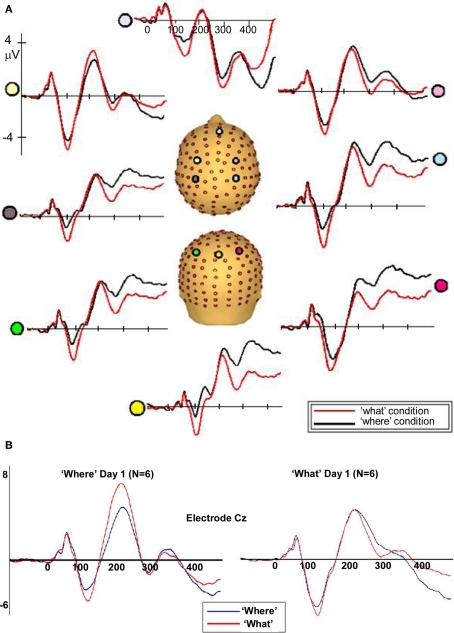
Figure 5.
(A) Auditory evoked potentials in participants generated during the WHAT task (red) and the WHERE task (black). Data from eight electrodes spanning frontal, central, and centro-parietal regions are presented. (B) Representative electrode from subgroups of the six subjects who participated in the WHAT condition first (Day 1) and the six who participated in the WHERE condition first.

