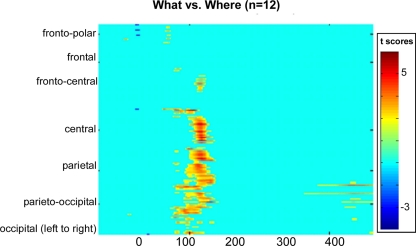
Figure 8.
Statistical cluster plot of the results of the point-wise running two-tailed t-tests comparing the amplitudes of participants’ auditory evoked potentials in the WHAT versus WHERE conditions. Time with respect to stimulus onset is presented on the x axis and topographic regions of 168 electrode positions on the y axis. Color corresponds to t values. Periods of significant difference are only plotted if a strict alpha criterion of <0.05 was exceeded for at least five consecutive data points.

