
Figure 2.
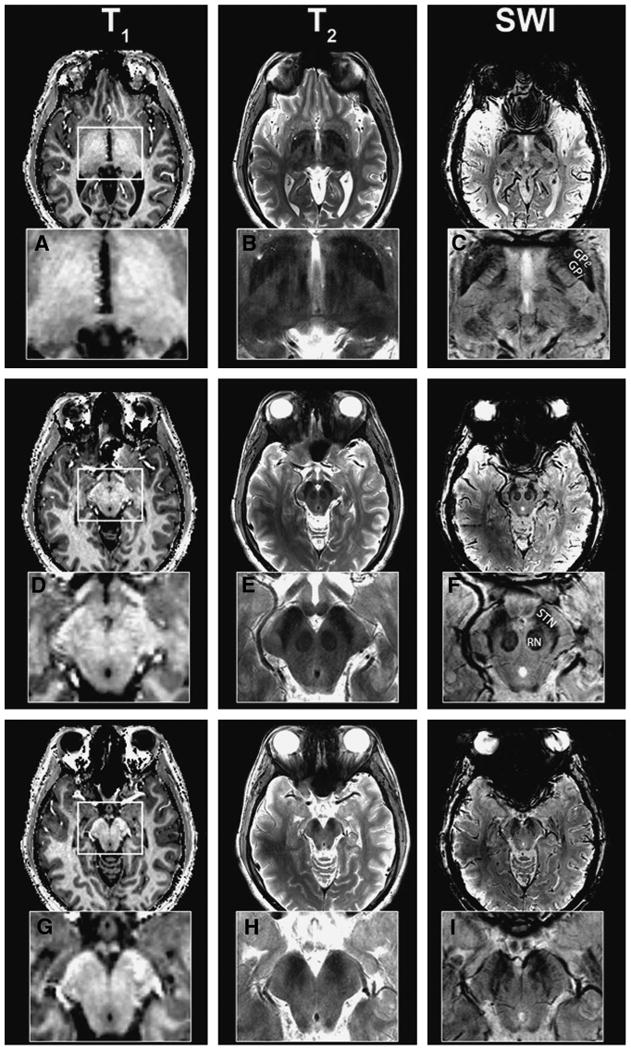
Image contrasts at 7 T. Axial brain images obtained with susceptibility-weighted imaging (SWI) at 7 T at the level of globus pallidus interna (GPi) and thalamus (A-C), subthalamic nucleus (STN; D-F), and substantia nigra (SN) caudal to STN (G-I). To emphasize the contrast differences, an inset of the magnifed midbrain region (white box) is shown. T1-weighted images have no obvious identifiable structures (A, D, G); T2-weighted images (B, E, H) delineate major nuclei; SWI images (C, F, I) exhibit an abundance of fine structural details within the same region (see text).