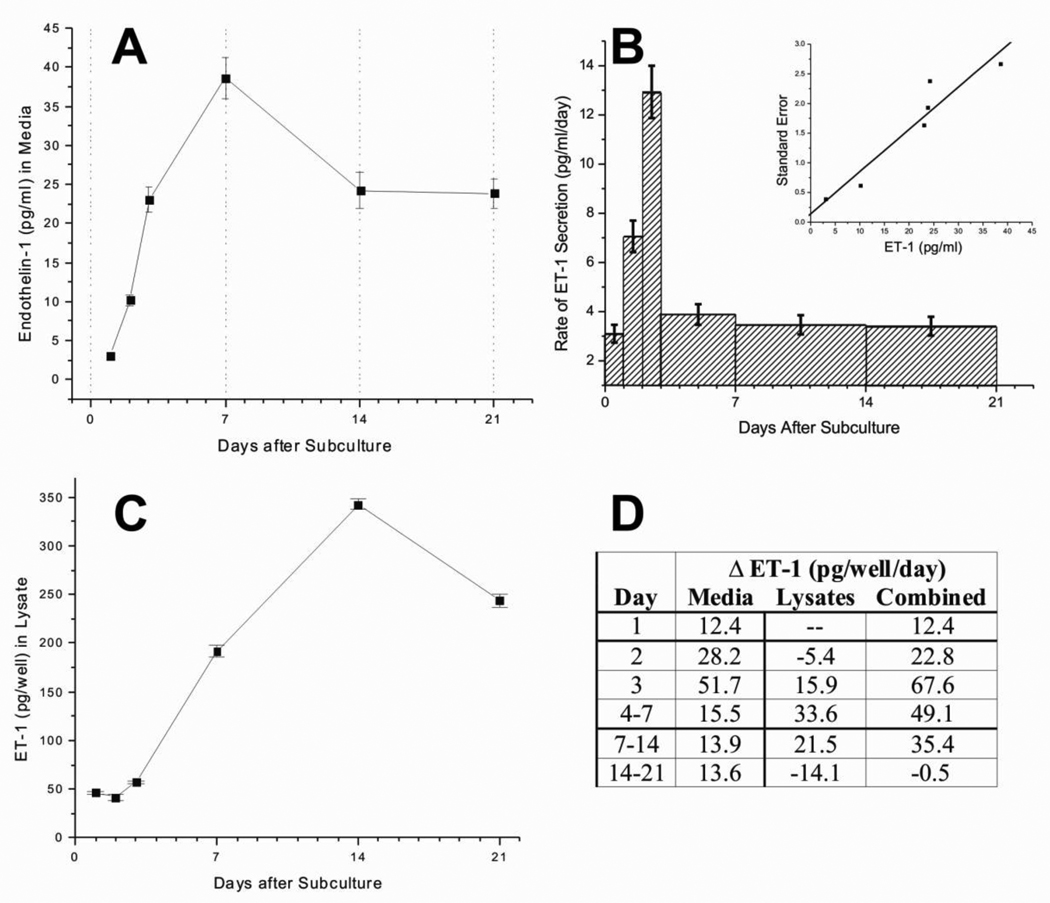
Figure 1. ET-1 production and secretion by adult rat astrocyte cultures.
Panel A shows ET-1 measured in media. Media was changed every 7 days (dotted lines) so that measurements on days 1,2,3, and 7 represent ET-1 accumulated since subculturing (time 0), whereas measurements on days 14 and 21 represent ET-1 accumulated over the previous week (since the last media change). Separate replicate wells were used for each time-point so media volumes remained constant. Panel B shows the average change in ET-1 concentration per day, over a length of time indicated by the width of the bars. Standard errors were extrapolated from a linear fit of SEs from panel A (see inset). Panel C shows ET-1 measured in cell lysates. Panel D shows the combined rate of change of ET-1 levels in the media and lysates per well over the 21-day time course. Each well had 4 ml of media, so multiplying the values in panels A and B by 4 provides pg/well. Error bars = ±SE.

