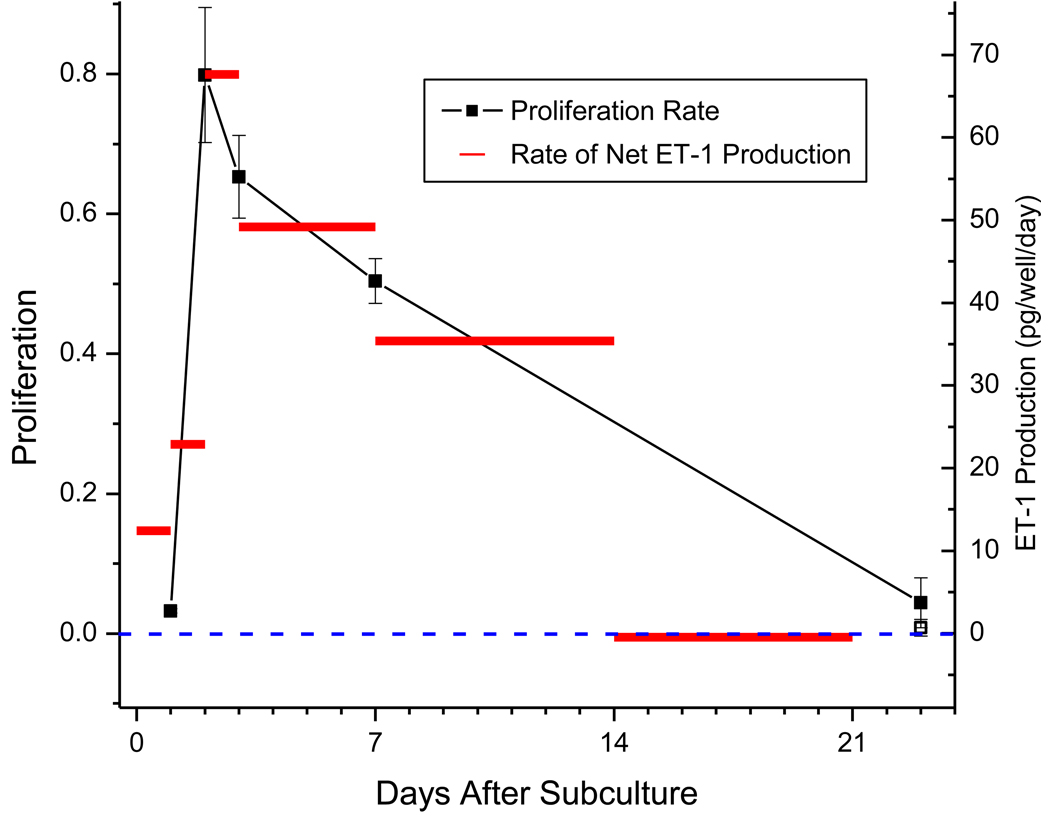
Figure 2. ET-1 production rate correlates with proliferation (DNA synthesis).
The open-box data point at day 23 represents DNA synthesis following 2-days of serum starvation (0.1% serum). The left Y-axis has been normalized from zero to one. The horizontal red bars are the values from the “Combined” column in panel D of Figure 1, the average change in ET-1 concentration per day averaged over the length of time indicated by the width of the bars. Error bars = ±SE.

