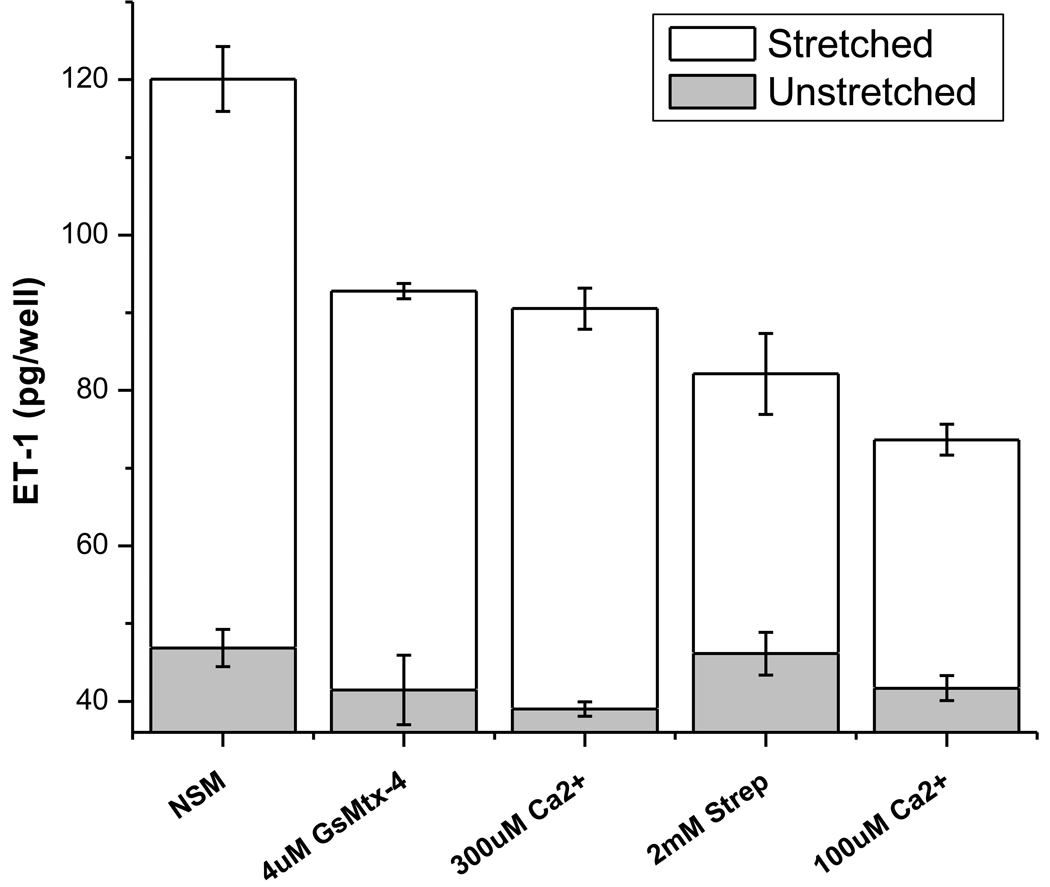
Figure 4. ET-1 in the media increases with stretch and Ca2+ influx.
NSM = “normal starvation media” that has 1.8 mM Ca2+. The grey bars are from unstretched controls. Error bars = ±SE. The data show stimulation by the mechanical input and inhibition by changes that reduce Ca2+ influx. (24h of cyclic stretch, 0.1 Hz, 0–20% strain).

