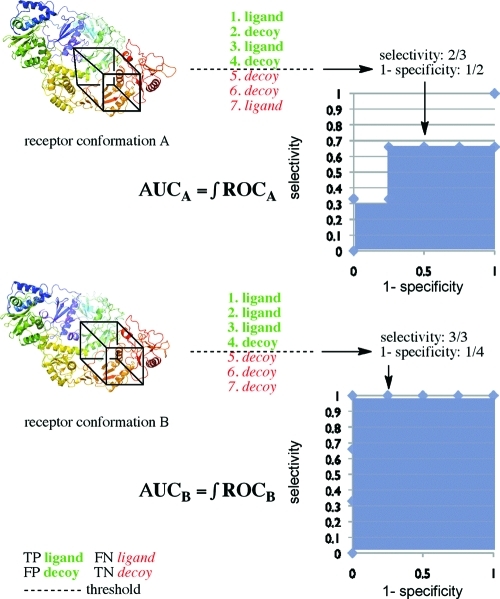
Figure 2.
Schematic representation of the practical approach employed for comparison of VS predictive power. Different A and B receptor conformations used in docking affect compound ranking, thus prediction selectivity and specificity. The integral of a ROC curves (also named AUC) is the metric employed for nonarbitrary comparison of VS predictive power.

