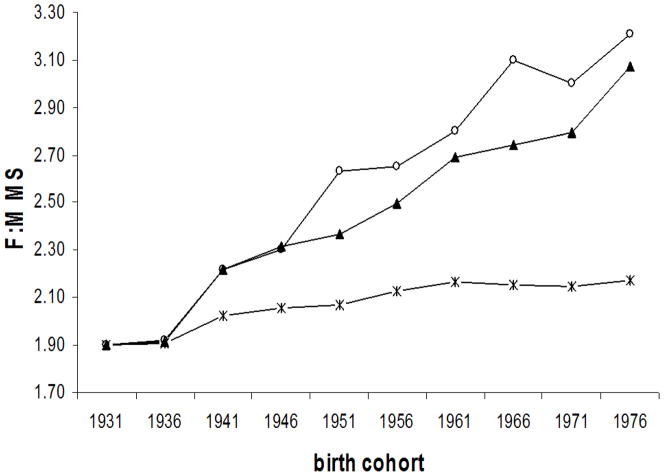
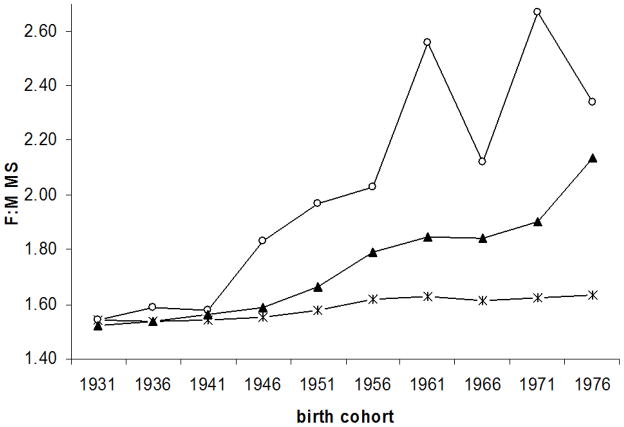
Figure 3.
Observed (
 ) and expected [under assumption 11: (
 ) and under assumption 22(▴) female to male MS incidence by birth cohort.
| A. Canada
|
|
|
| B. Denmark
|
Assumptions:
1: In both males and females, the IRR of MS in smokers compared to non-smokers =1.4
2: In females, the IRR of MS in smokers compared to non-smokers =1.6 In males, the IRR of MS in smokers compared to non-smokers = 2.7 [24]
A) Canada:
Under assumption 1 above, rate of change in observed MS: 7.66% per 5 year period; Rate of change in expected MS: 1.58% per 5 year period; Percent of F:M MS ratio potentially explained by smoking: 20.6%
Under assumption 2 above, rate of change in observed MS: 7.66% per 5 year period; Rate of change in expected MS: 6.86% per 5 year period; Percent of F:M MS ratio potentially explained by smoking: 89.6%
B) Denmark:
Under assumption 1 above, rate of change in observed MS: 4.8 % per 5 year period; Rate of change in expected MS: 0.67% per 5 year period; Percent of F:M MS ratio potentially explained by smoking by birth cohort: 14.0%
Under assumption 2 above, rate of change in observed MS: 4.8 % per 5 year period; Rate of change in expected MS: 4.5% per 5 year period; Percent of F:M MS ratio potentially explained by smoking by birth cohort: 94%


