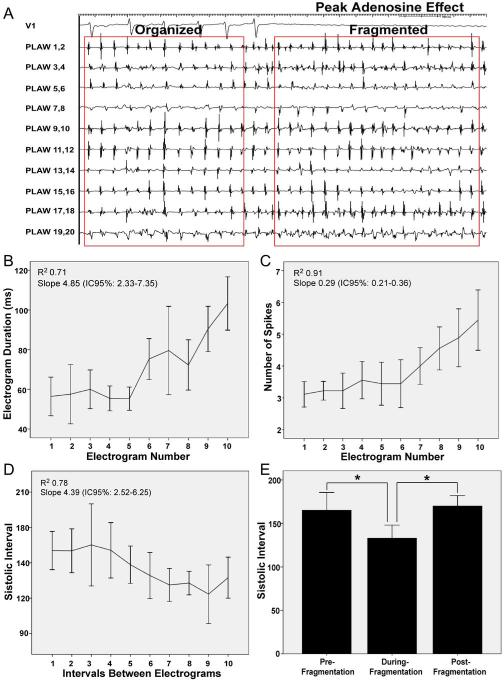
Figure 4. Adenosine infusion.
A. Tracings during peak adenosine effect. Lead V1 and intracardiac electrograms recorded from spiral catheter at the posterior left atrial wall (PLAW). At peak adenosine effect (complete AV block) transition from organized to fragmented electrograms is observed, with simultaneous cycle length shortening. B, C and D. Electrogram duration, number of spikes and systolic interval (SI) during transitions from organized to fragmented electrograms (first 10 complexes). E. Mean values of SI before and during fragmentation, and after resumption of organization.

