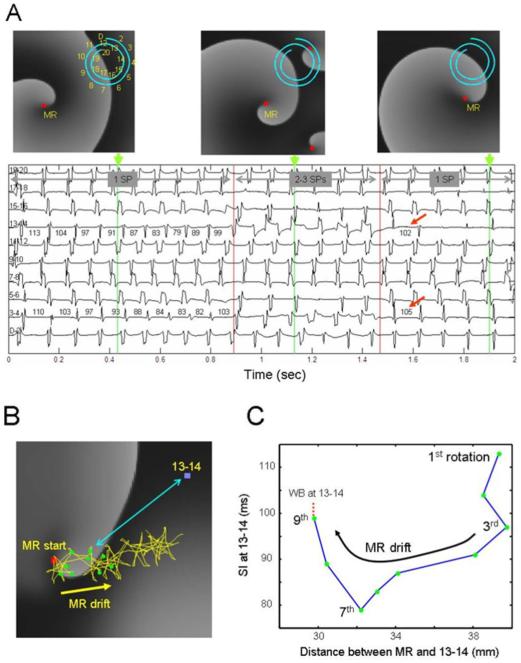
Figure 8. Simulation of a drifting rotor with peripheral wavebreaks (WB) in an atrial model.
A. Snapshots of the model membrane voltage are at times indicated by the green markers. A 20 electrode catheter (D-20) shown on snapshots indicates locations of 10 pseudo-bipoles shown below maps. Red squares: Pivoting sites of rotors (i.e., singularity point; SP) Numbers on bipoles 3–4 and 13–14 indicate cycle length in ms. Horizontal gray arrows indicate episodes with a single mother rotor (MR, 1 SP), additional 2 short living rotors after ~0.9 sec (3 SPs) and their disappearance after ~1.5 sec (1 SP). Red arrows denote return of cycle length to pre-shortening phase. B. Trajectory of the drifting rotor's tip (yellow trace and arrow) superimposed on a snapshot of voltage at time=0. Red square, starting point of the drift; green dots, the location of the tip at the completion of each of 9 initial rotations; blue square, location of bipoles 13–14; double-headed blue arrow, distance between 13–14 bipoles and a sample position of the rotor's tip. C, Systolic Interval (SI) at bipoles 13–14, as a function of distance between the rotor's tip and the bipoles' location. As the drifting rotor gets closer to the bipoles, SI abbreviates due to Doppler shift, particularly after the 3rd rotation. After the 7th rotation, local conduction impairment at 13–14 increases SI with an eventual WB.

