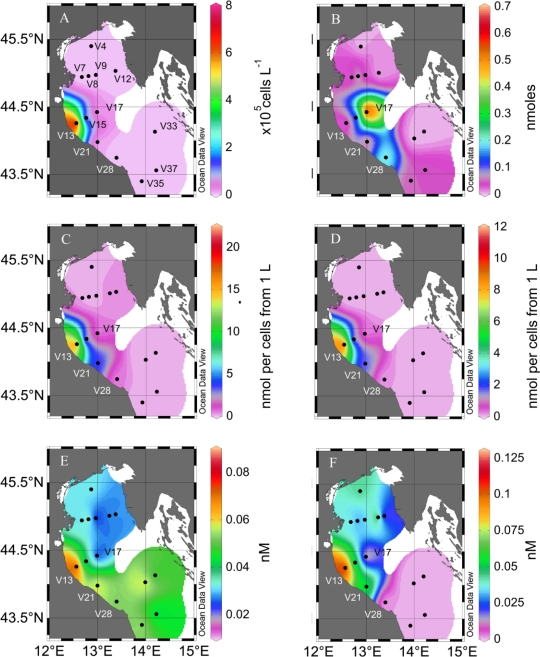
Figure 1.
Surface distribution (0–1 m) of dissolved and particulate PUA in the Adriatic Sea in February 2008. (A), S. marinoi cell density. (B), particulate heptadienal produced by the 1.2 μm > x > 0.2 μm fraction from 1 L of seawater. (C), particulate heptadienal and (D), octadienal produced by the >1.2 μm fraction obtained from 1 L of seawater. (E), dissolved heptadienal and (F), octadienal concentrations in the seawater. The closed circles indicate the sampling stations. Note the different scaling. The colored surfaces are representation of the data presented in Table 1 and are only used to facilitate the visualization. They are not extrapolations of the concentrations.

