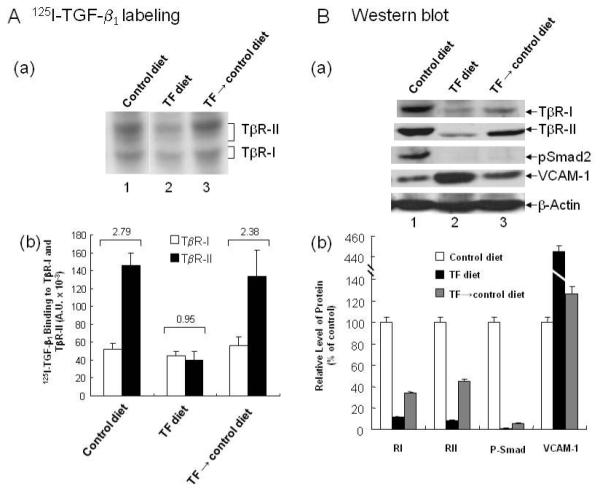
Fig. 1. 125I-TGF-β affinity labeling (A) and Western blot analysis (B) of the aortic endothelium in mice fed TF and control diets.

Groups of mice were fed TF and control diets for 24 weeks and were termed the TF and control diet groups, respectively. Another group of mice was fed the TF diet for 16 weeks and then the control diet for additional 8 weeks and was termed the TF→control diet group. At the end of the experiment, the aortic endothelium of these mice was subjected to 125I-TGF-β affinity labeling (A) and Western blot analysis using antibodies to TβR-I, TβR-II, P-Smad2, Smad2, VCAM-1 and β-actin (B). 125I-TGF-β affinity-labeled TβR-I and TβR-II were quantified by a PhosphoImager and expressed as arbitrary units (A.U.). An autoradiogram representative of 125I-TGF-β affinity labeling in the aortic endothelium is shown in panel a (A). The average ratio of 125I-TGF-β binding to TβR-II compared to 125I-TGF-β binding to TβR-I (TβR-II/TβR-II binding) was estimated form 5 mice for each experimental group, as shown in the top of panel a (A). The relative protein levels of TβR-I, TβR-II, P-Smad2, Smad2, VCAM-1 and β-actin were quantified by densitometry (B). The levels in mice fed the control diet were taken as 100%. A representative of a total of 5 animals in each group analyzed is shown (B, panel a). The relative levels of TβR-I, TβR-II, P-Smad2 and VCAM-1 were estimated from the 5 animals in each group; values are mean ± s.d. (B, panel b). The relative levels of Smad2 in mice fed TF, control and TF→control diets for a total of 24 weeks were very similar (data not shown).
