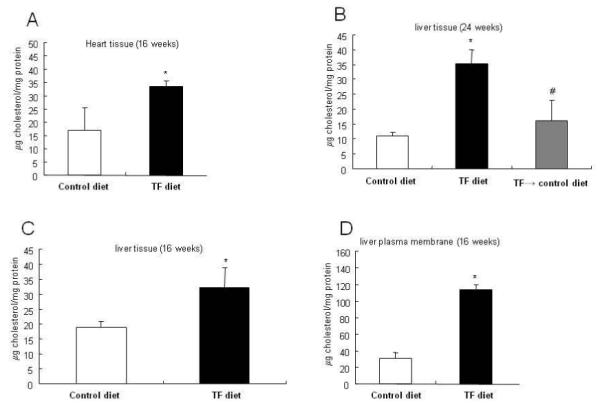
Fig. 3. Cholesterol content in hearts and livers of mice fed TF and control diets.

The cholesterol content in hearts and livers of mice fed a TF diet or control diet for 16 or 24 weeks or fed a TF diet for 16 weeks and control diet for additional 8 weeks (TF→control diet) expressed as μg per mg tissue protein is shown. The cholesterol content of purified liver plasma membranes was also determined as per mg membrane protein. The data were estimated from a total of 6-8 mice in each group analyzed; values are mean ± s.d. *Significantly higher than control diet groups (p< 0.05). #Significantly lower than TF diet groups (p< 0.05).
