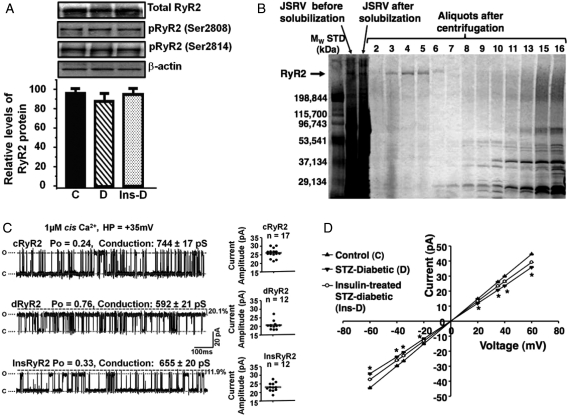
Figure 1.
Purification of RyR2 and assessment of gating and conductance. (A) Representative autoradiograms of total RyR2 and their phosphorylation status at Ser2808 and Ser2814 after isolation from control (C), diabetic (D), and insulin-treated diabetic (Ins-D) animals. (B) A typical silver-stained electrophoretogram of fractions collected after linear sucrose gradient purification. (C) Left show representative 1 s single-channel recordings of RyR2 purified from control animals (cRyR2), diabetic animals (dRyR2), and insulin-treated animals (InsRyR2). Mean current amplitude for ≥12 channels from three separate preparations are shown in (C), right. (D) Mean current–voltage relationship for cRyR2, dRyR2, and InsRyR2. *Denotes significantly different from control (P< 0.05).

