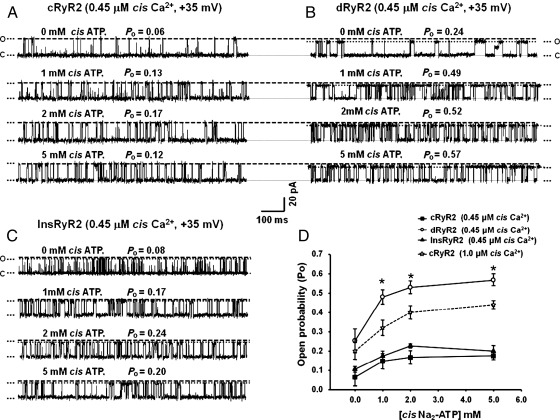
Figure 3.
Comparison of the responsiveness of cRyR2, dRyR2, and InsRyR2 to cis [ATP]. (A) The response of cRyR2 to increasing cis ATP, (B) the response of dRyR2 to increasing cis ATP, and (C) the response of InsRyR2 to increasing cis ATP. (D) Mean ± SEM for ≥8 channels per group. *Denotes significantly different from control (P< 0.05).

