Figure 5.
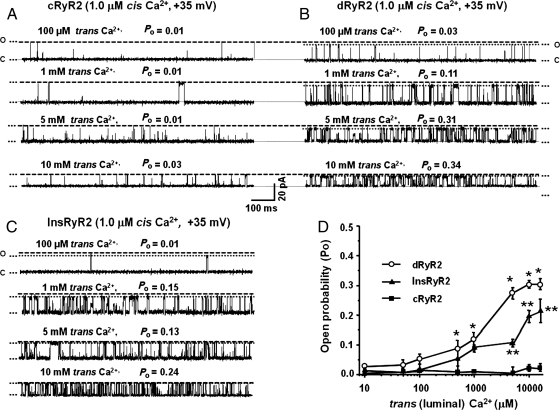
Comparison of the responsiveness of cRyR2, dRyR2, and InsRyR2 to increasing trans Ca2+ (cis Ca2+ = 1.0 µM). (A) The response of cRyR2 to increasing trans Ca2+, (B) the response of dRyR2 to increasing trans Ca2+, and (C) the response of InsRyR2 to increasing trans Ca2+. (D) Mean ± SEM for ≥8 channels per group. *Denotes significantly different from control (P< 0.05). **Denotes significantly different from STZ-diabetic (P< 0.05).

