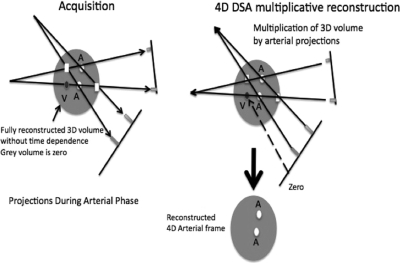
Figure 10.
Illustration of the data acquisition and multiplicative reconstruction step for 4D DSA. For each time frame two projections and the reconstructed 3D DSA volume are used. In the gray areas where vessels are not present the volume is zero. Where the detected rays cross the vessels in the 3D volume signal is deposited in the backprojection step (circles) Where the 3D volume is zero the multiplication produces zero signal (squares). In arterial phase projections, veins are still zero and the projection multiplies the vein in the 3D DSA volume by zero.

