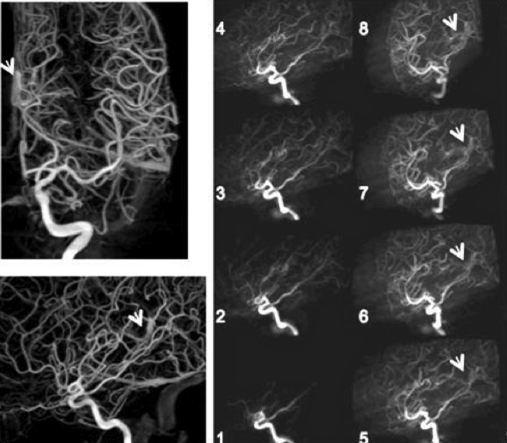
Figure 11.
Early filling of the vein of Galen. Two projections from a 3D DSA (left) and MIPS through a 4D DSA(right) derived by using two of the 220 projections used to form the 3D volume. Dynamic filling of the vascular structures is clearly seen on the rotating 4D DSA volume as indicated by the arrows

