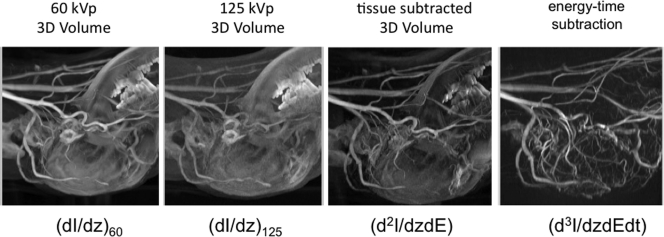
Figure 13.
Progression of images involved in the formation of the time/energy subtracted CT angiographic volume. Shown are MIPs through the 3D DSA volumes at 60 and 125 kVp, a tissue subtracted MIP at one point in time, and a time-energy 4D DSA MIP. Note that unlike the previous mode introduced by Brody (Ref. 14) signal to noise ratio is adequate. The derivatives refer to the image classification scheme defined in Ref. 52.

