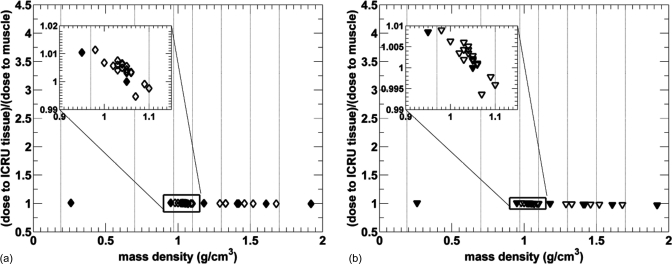
Figure 8.
Relative dose to tissue as a function of tissue mass density for 34 ICRU tissues from irradiation with an extensively filtered 320 kV beam with <E> = 237 keV (a) and a 192Ir source with <E> = 346 keV (b). Tissues used in 4-tissue and 8-tissue model small animal dose calculations are plotted with filled symbols and vertical lines indicated the tissue segmentation ranges. Statistical uncertainties of <1.4% are not plotted for clarity.

