Figure 6.
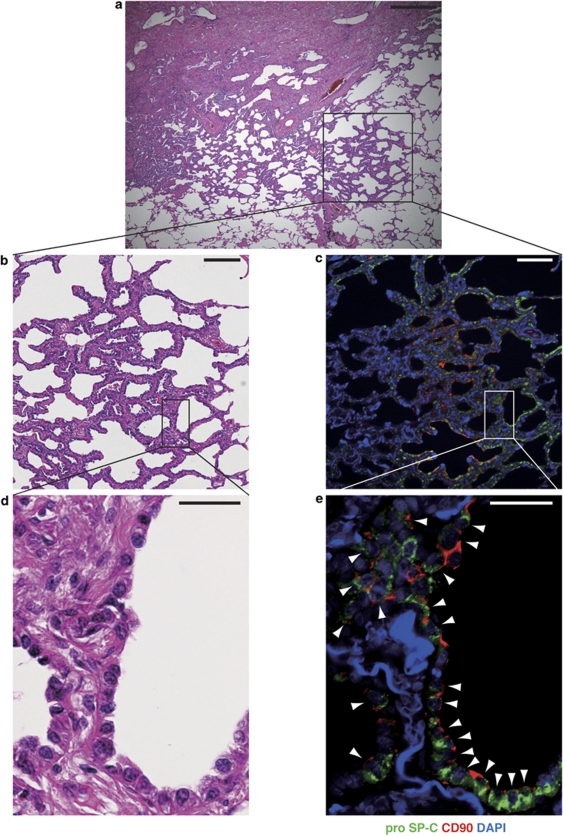
Representative histological analysis of lung tissues derived from an adenocarcinoma patient: HE staining (a, b, d) and immunofluorescence staining for pro-SP-C and CD90 (c, e). Images in (b, c) and (d, e) are shown from mirror sections, respectively. (a) A lower magnification of lung adenocarcinoma. (b, c) Higher magnifications from (a). Well-differentiated adenocarcinoma in (b) showed expression of pro-SP-C (green) and CD90 (red) in (c). (d, e) Higher magnifications from (b, c). Cancer cells that showed severe atypical nuclei and clear nucleoli in (d) expressed both pro-SP-C and CD90 in (e, arrowheads). Scale bars: (a–c) 400 μm (d, e) 50 μm.

