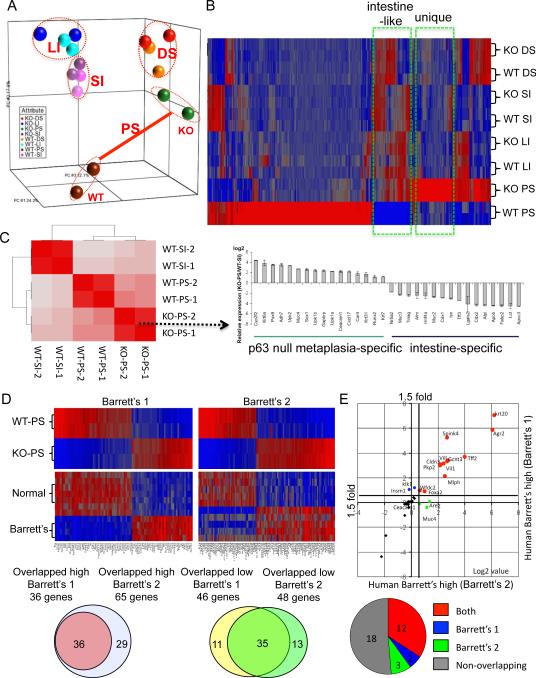
Figure 2.
Gene expression of metaplasia in p63 null embryos
A. A three-dimensional representation of a Principle Component Analysis of expression microarray data derived from gastrointestinal tract tissues of E18 wild type (WT) and p63 null (KO) embryos. PS, proximal stomach; DS, distal stomach; LI, large intestine; SI, small intestine. B. Heat map of expression microarray data from gastrointestinal tract anchored by a comparison between wild type and p63 null proximal stomach datasets. C. Hierarchical correlation analysis of whole genome data sets from wild type and p63 null tissues. Histogram depicts expression profiles of genes selected to emphasize metaplasia-specific and intestine-specific genes. D. Heat maps of differentially-expressed genes in wild type and p63 null proximal stomach and corresponding expression patterns in two different datasets of normal human esophagus and Barrett's metaplasia (Barrett's #1 from Stairs et al., 2008; Barrett's #2 from Kimchi et al., 2005). Below, Venn diagrams showing the overlap of genes from the two Barrett's dataset that are also high (or low) in the p63 null metaplasia. E. Scatterplot of up-regulated genes in Barrett's esophagus from two different datasets that are also in the top 50 overexpressed genes in metaplasia of the p63 null mouse. Pie chart indicates relative intersection of 35 most overexpressed gene of p63 null metaplasia with the Barrett's datasets. See also Figure S2, Figure S3, Table S1, Table S2, and Table S3.

