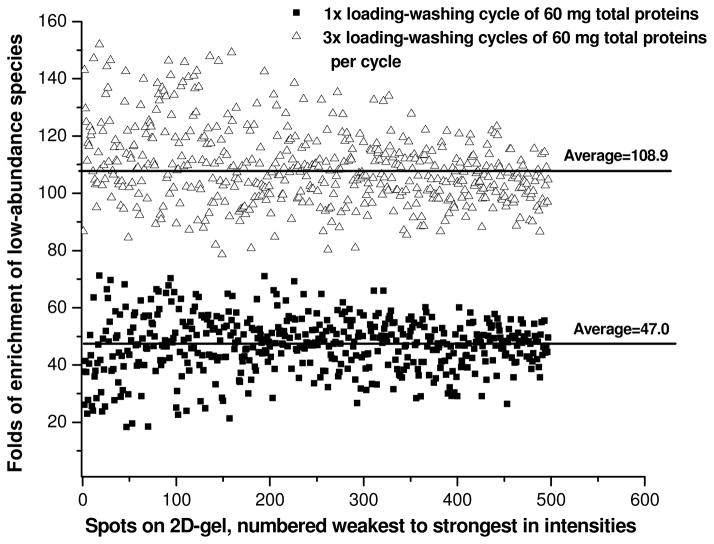
Fig. 2.
Comparison of the enrichment of low-abundance proteins by single loading-washing cycle vs. triple loading-washing cycles. Each cycle loaded 60 mg of total proteins (the mass ratio of plasma vs. E. Coli. proteins was 200:1, n=4). Quantitative values were obtained by 2D-DIGE scanning of the labeled E. Coli. The ratios for the most intensive 500 spots matched on both gels are shown.

