
Figure 3.
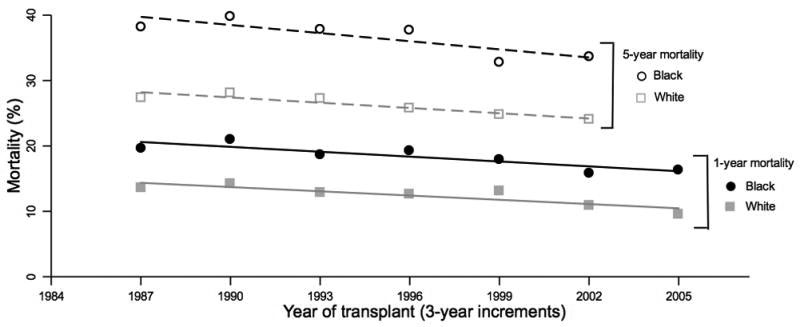
One- and five-year mortality estimates for black and white heart transplant recipients by 3-year increments adjusted for recipient age, gender, and diagnosis; donor age; and medical condition. Lines represent weighted linear regression fitted values of one-year mortality among blacks(—) and whites(
 ) and five-year mortality estimates among blacks(---) and whites(
 ).
).