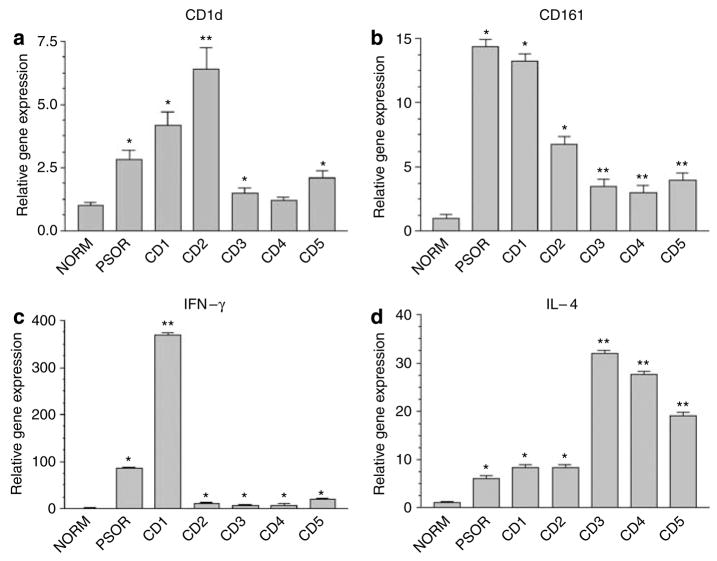
Figure 1. Gene expression profiling in ACD.
Real-time PCR comparing CD1d gene expression in normal skin (NORM), psoriasis (PSOR) and five cases of ACD (CD1–5). In each case, the biopsy specimen from psoriasis or contact dermatitis was compared to the paired normal control from the same patient. For the sake of simplicity, all six normal skin controls are represented as pooled data (NORM). (a) CD1d. (b) CD161; (c) IFN-γ; (d) IL-4. (*P<0.05; **P<0.001, compared to normal skin, ANOVA). The data depicted represent mean±SD for all real-time PCR experiments).

