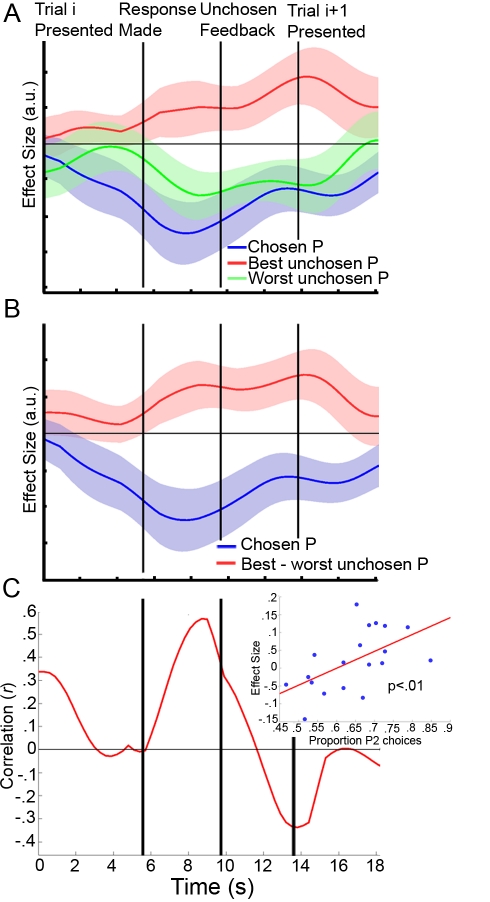
Figure 5. LFPC effect predicts individual differences in behavior.
(A) Time course is plotted on the subset of trials during which there was no second decision across the entire trial. (B) Time course of LFPC effects of the best minus the worst unchosen probability (red) and the chosen probability (blue) in condition 1 are shown plotted across the trial. Conventions are the same as in Figure 4. (C) Between-subject correlation is plotted across the trial. The curve depicts the correlation (r) between the effect of the best minus the worst unchosen probability in the LFPC from conditions 2 and 3 (i.e., when there was a second decision) and the proportion of trials on which participants chose the option with the highest reward probability at the second decision. Inset: scatterplot of the effect size against the behavioral index at the time of the first peak in the effect of the best relative to the worst unchosen probability from condition 1 shown in (B). The time point selected for the scatterplot is thus unbiased with respect to the data used for the between-subject analysis.

