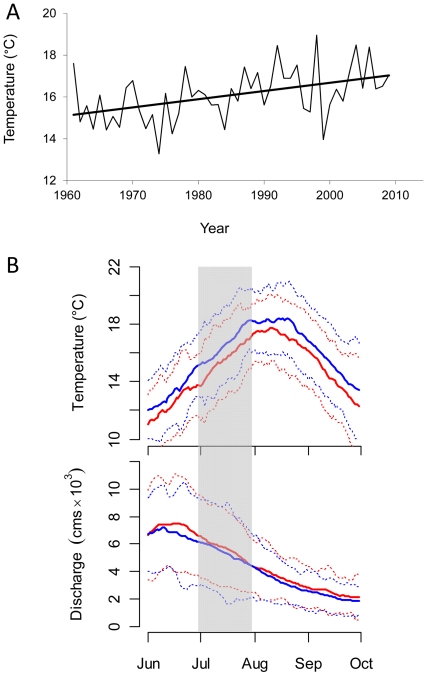
Figure 2. Inter-annual and intra-annual patterns in river temperatures and flows.
(A) Average July water temperature at Qualark as a function of year. Dark line indicates significant (P<0.01) linear trend towards increasing temperatures (slope = 0.04°C year−1). (B) Mean temperature and discharge (±2 SD, dotted lines) for the lower Fraser River for June–October from 1961–1990 (red lines) and from 1991–2009 (blue lines). The shaded area indicates a symmetric 31-day period around the historical median run timing date for Early Stuart sockeye (July 14).

