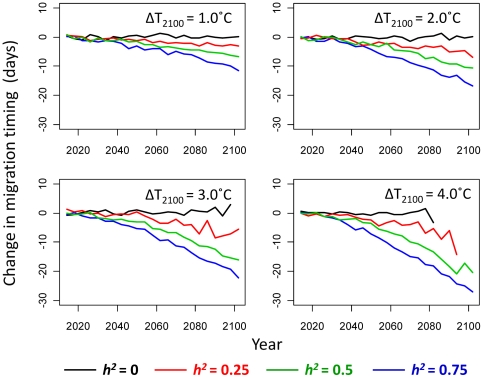
Figure 4. Projected evolutionary trajectories for each warming scenario.
Projected future evolutionary changes, averaged across 100 replicate model runs, in mean migration timing (days relative to the historic median Hell's Gate migration date of July 14) for different simulated river warming scenarios, assuming no flow effect on survival (i.e., PF = 1). Black curves: heritability (h2) of migration timing = 0; red curves: h2 = 0.25; green curves: h2 = 0.5; blue curves: h2 = 0.75.

