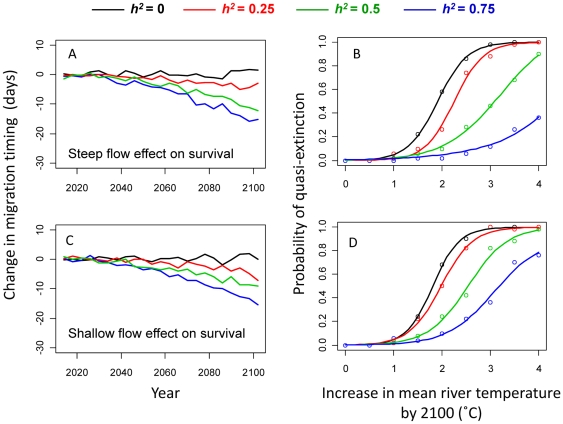
Figure 6. Sensitivity of main results to flow effects.
Sensitivity of results to including a flow effect on migration survival. Left panels show projected evolutionary changes in mean migration timing for a scenario where mean river temperature increases by 2°C by 2100, assuming either a steep flow effect (A) or a shallow flow effect (C) on migration survival. Right panels show probability of quasi-extinction across all river warming scenarios for the same steep (B) and shallow (D) flow effects on survival. The default sigmoid temperature-survival curve (dark curve in Fig. 3B) was used in all cases. Data points show means of 100 replicates; curves are best sigmoid fits to data. Black curves: heritability (h2) of migration timing = 0; red curves: h2 = 0.25; green curves: h2 = 0.5; blue curves: h2 = 0.75.

