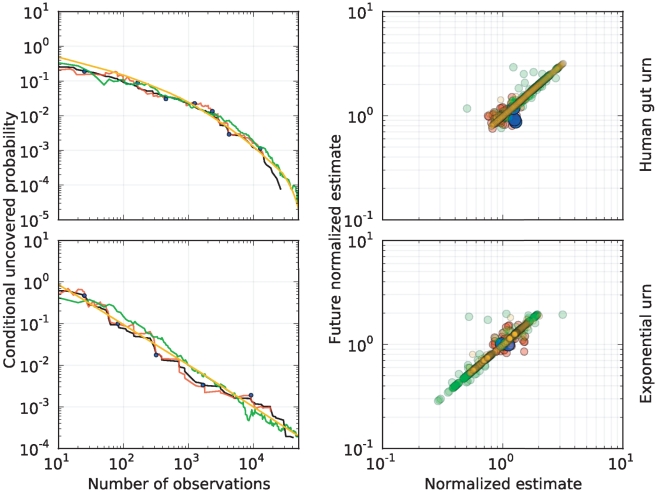
Figure 1. Point predictions in a human-gut and exponential urn.
Plots associated with a human-gut (top-row) and exponential urn (bottom-row). Left-column, sequential predictions of the conditional uncovered probability (black), as a function of the number  of observations, using Robbins' estimator in equation (1) (green), Starr's estimator in equation (2) (orange), and the Embedding algorithm (blue, red), over a same sample of size
  from each urn. Starr's estimator was implemented keeping
  . Blue predictions correspond to consecutive outputs of the Embedding algorithm in Table 1, which was reiterated until exhausting the sample using the parameter
  . Red predictions correspond to outputs of the algorithm each time a new species was discovered. Right-column, correlation plots associated with consecutive predictions of the conditional uncovered probability (normalized by its true value at the point of prediction), under the various methods. The green and orange clouds correspond to pairs of predictions, 100-observations apart, using Robbins' and Starr's estimators, respectively. Blue and red clouds correspond to pairs of consecutive outputs of the Embedding algorithm, following the same coloring scheme than on the left plots. Notice how the red and blue clouds are centered around
  , indicating the accuracy of our methodology in a log-scale. Furthermore, the green and orange clouds show a higher level of correlation than the blue and red clouds, indicating that our method recovers more easily from previously offset predictions. In each urn, our predictions used the
  observations and a HPP with intensity one–simulated independently from the urn–to predict sequentially the uncovered probability of the first part of the sample. See Fig. 4 for the associated rank curve in each urn.

