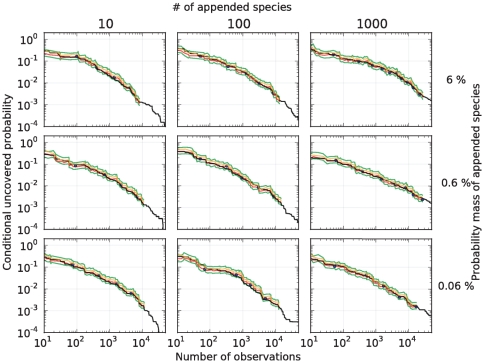
Figure 7. Predictions in the human-gut urn when simulating the rare biosphere.
In a sample of size  from a human-gut,
  species were discovered. Based on our methods, we estimate that
  of these species represent
  of that gut environment; hence, the remaining
  is composed by at least
  species. To test our predictions of the conditional uncovered probability (black), we simulated the rare biosphere by adding additional species and hypothesized that our point prediction could be offset by up to one order of magnitude: point predictions produced by the Embedding Algorithm (blue), point predictions produced by the algorithm each time a new species was discovered (red),
  upper-bound (orange), and
  conservative-upper interval (green). The predictions used the parameters
  . The different urns were devised as follows. For each
  (indexing rows) and
  (indexing columns), a mixture of two urns was considered: an urn with the same distribution as the microbes found in the gut dataset, and weighted by the factor
  , and an urn consisting of
  colors (disjoint from the gut urn), with an exponentially decaying rank curve and weighted by the factor
  . See Fig. 5 for the rank curve associated with each urn.

