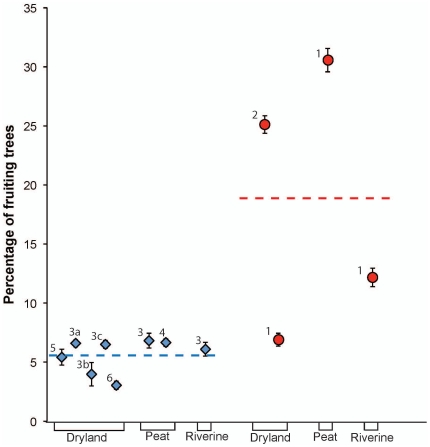
Figure 3. Mean fruit availability per site.
Graph of time-series corrected model mean estimates of the percentage of fruiting trees and 95% confidence intervals for all sites in Borneo and Sumatra separated by habitat type. Field sites in Borneo are represented by blue triangles and those in Sumatra are represented by red circles. The numbers in the figure correspond to the following field areas or sites: 1 = Suaq Balimbing, 2 = Ketambe, 3 = Gunung Palung, 3a = Gunung Palung AB, 3b = Gunung Palung LG, 3c = Gunung Palung LS, 4 = Tanjung Puting, 5 = Barito Ulu, 6 = Sungai Wain.

