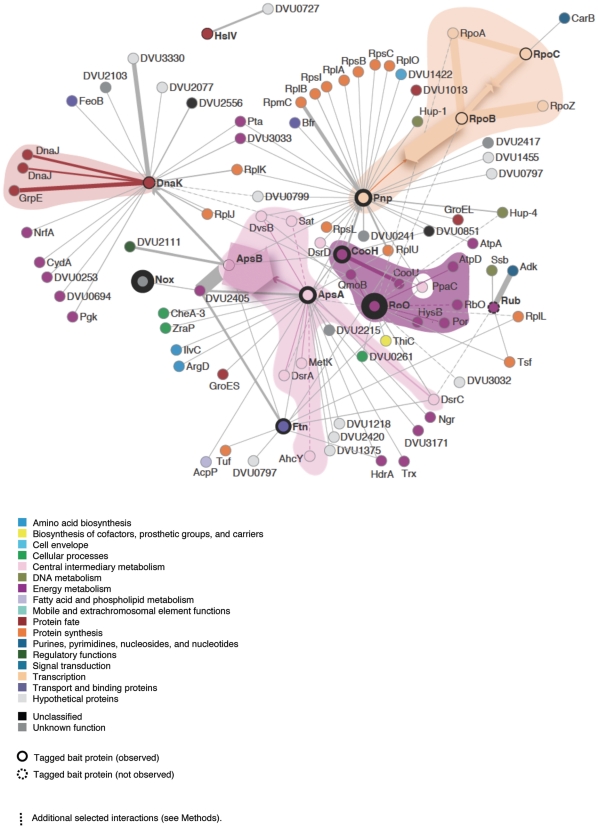
Figure 2. Partial D. vulgaris Hildenborough (JW801) high confidence protein-protein interaction network.
Shown are the high confidence bait-prey protein interaction pairs from this study. Edges connecting nodes indicate a detected high confidence interaction between a bait and a pulled down prey protein. Nodes in the network are colored by TIGR functional role, as are edges where both nodes belong to the same TIGR role. Bait protein nodes are surrounded by a thicker black circle proportional to the normalized adjusted median-max emPAI value for the bait protein. The dotted node indicates the bait, which was not observed (Rub). Dotted edges indicate interactions with a median-max emPAI value equal to the control but where the bait was also observed in the control with a high emPAI value (see Methods). Interconnected sets of nodes belonging to the same TIGR role are shaded with a lighter hue of the TIGR functional role color. Head-on arrows indicate reciprocally detected interactions and the width of the arrow corresponds to the normalized adjusted median-max emPAI value for the prey protein. Interactions corresponding to p<0.001 from bootstrap analysis are shown in Table S12.

