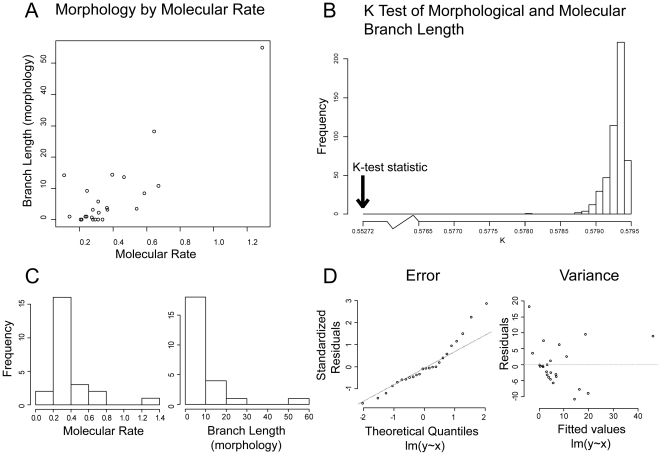
Figure 4. Graphical summary of molecular rate and morphological branch length variation.
(A) Individual node comparison of molecular rate (pairwise sequence divergence / million years) versus morphological branch length (steps required under parsimony). (B) K-tree null distribution, with test-statistic indicated by arrow. (C) Distribution of molecular rate (left) and morphological branch length (right) variation. (D) Graphical summary of linear model assumptions: non-linearity of error (left) and heterogeneity of variance (right).

