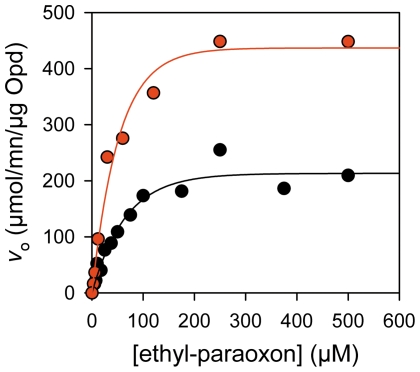
Figure 2. Catalytic properties of MamC-Opd in the magnetosomes sample.
Michaelis-Menten curves for immobilized (black) and purified (red) Opd. For each enzymatic assays, we used 26 ng of immobilized Opd (20 µl of magnetosomes suspension) and 200 ng of soluble Opd. The mean deviation between the fitted Michaelis-Menten curves (lines) and the experimental data points (circles) is 4.2% for both curves.

