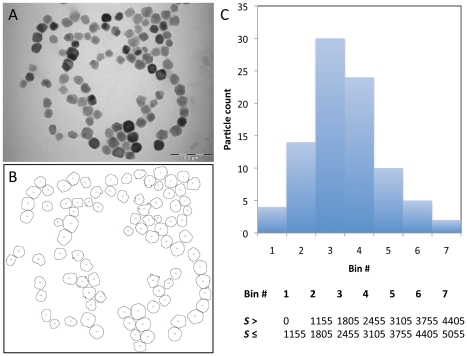
Figure 4. An estimate of the volume of a single particle from TEM images.
Scale bar is 0.2 µm. (a) Unprocessed TEM image of the functionalized magnetosomes. (b) Automatic particle counting and sizing analyzed by ImageJ. (c) Particles size distribution computed with 7 bins (boundaries are given in the table). The surface S is expressed in pixel2.

