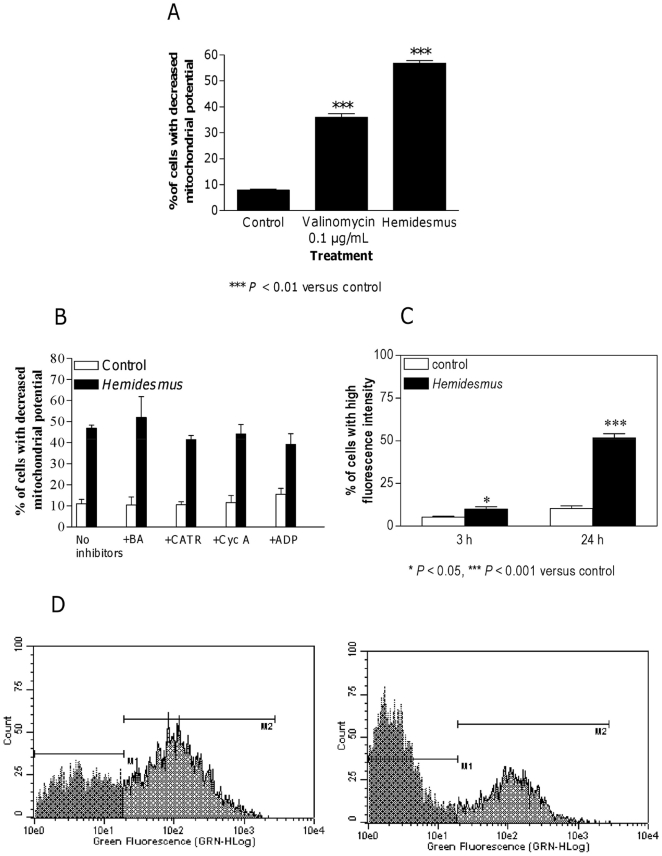
Figure 2. Fraction of cells with decreased mitochondrial potential and increased [Ca2+]i after Hemidesmus treatment.
Alterations in mitochondrial membrane permeability in absence (A) and presence (B) of inhibitors following treatment with Hemidesmus 0.93 mg/mL. Fraction of cells with increased [Ca2+]i following 3 or 24 h culture in the absence or presence of Hemidesmus (0.93 mg/mL) (C), flow cytometric analysis of [Ca2+]i following 24 h culture in the absence or presence of Hemidesmus (0.93 mg/mL) (D). M1 and M2 indicate the two different populations characterized by a different mean fluorescence intensity values. Data are means ± SEM of four independent experiments.

